If you're thinking of hunting Montana for mule deer, this giant data story is a must read to help you narrow down where to hunt! Access region by region breakdowns that take a look at harvest, residency and much, much more

Manage for the long-term welfare of Montana’s mule deer resource and provide recreational opportunities that reflect the dynamic nature of deer populations.
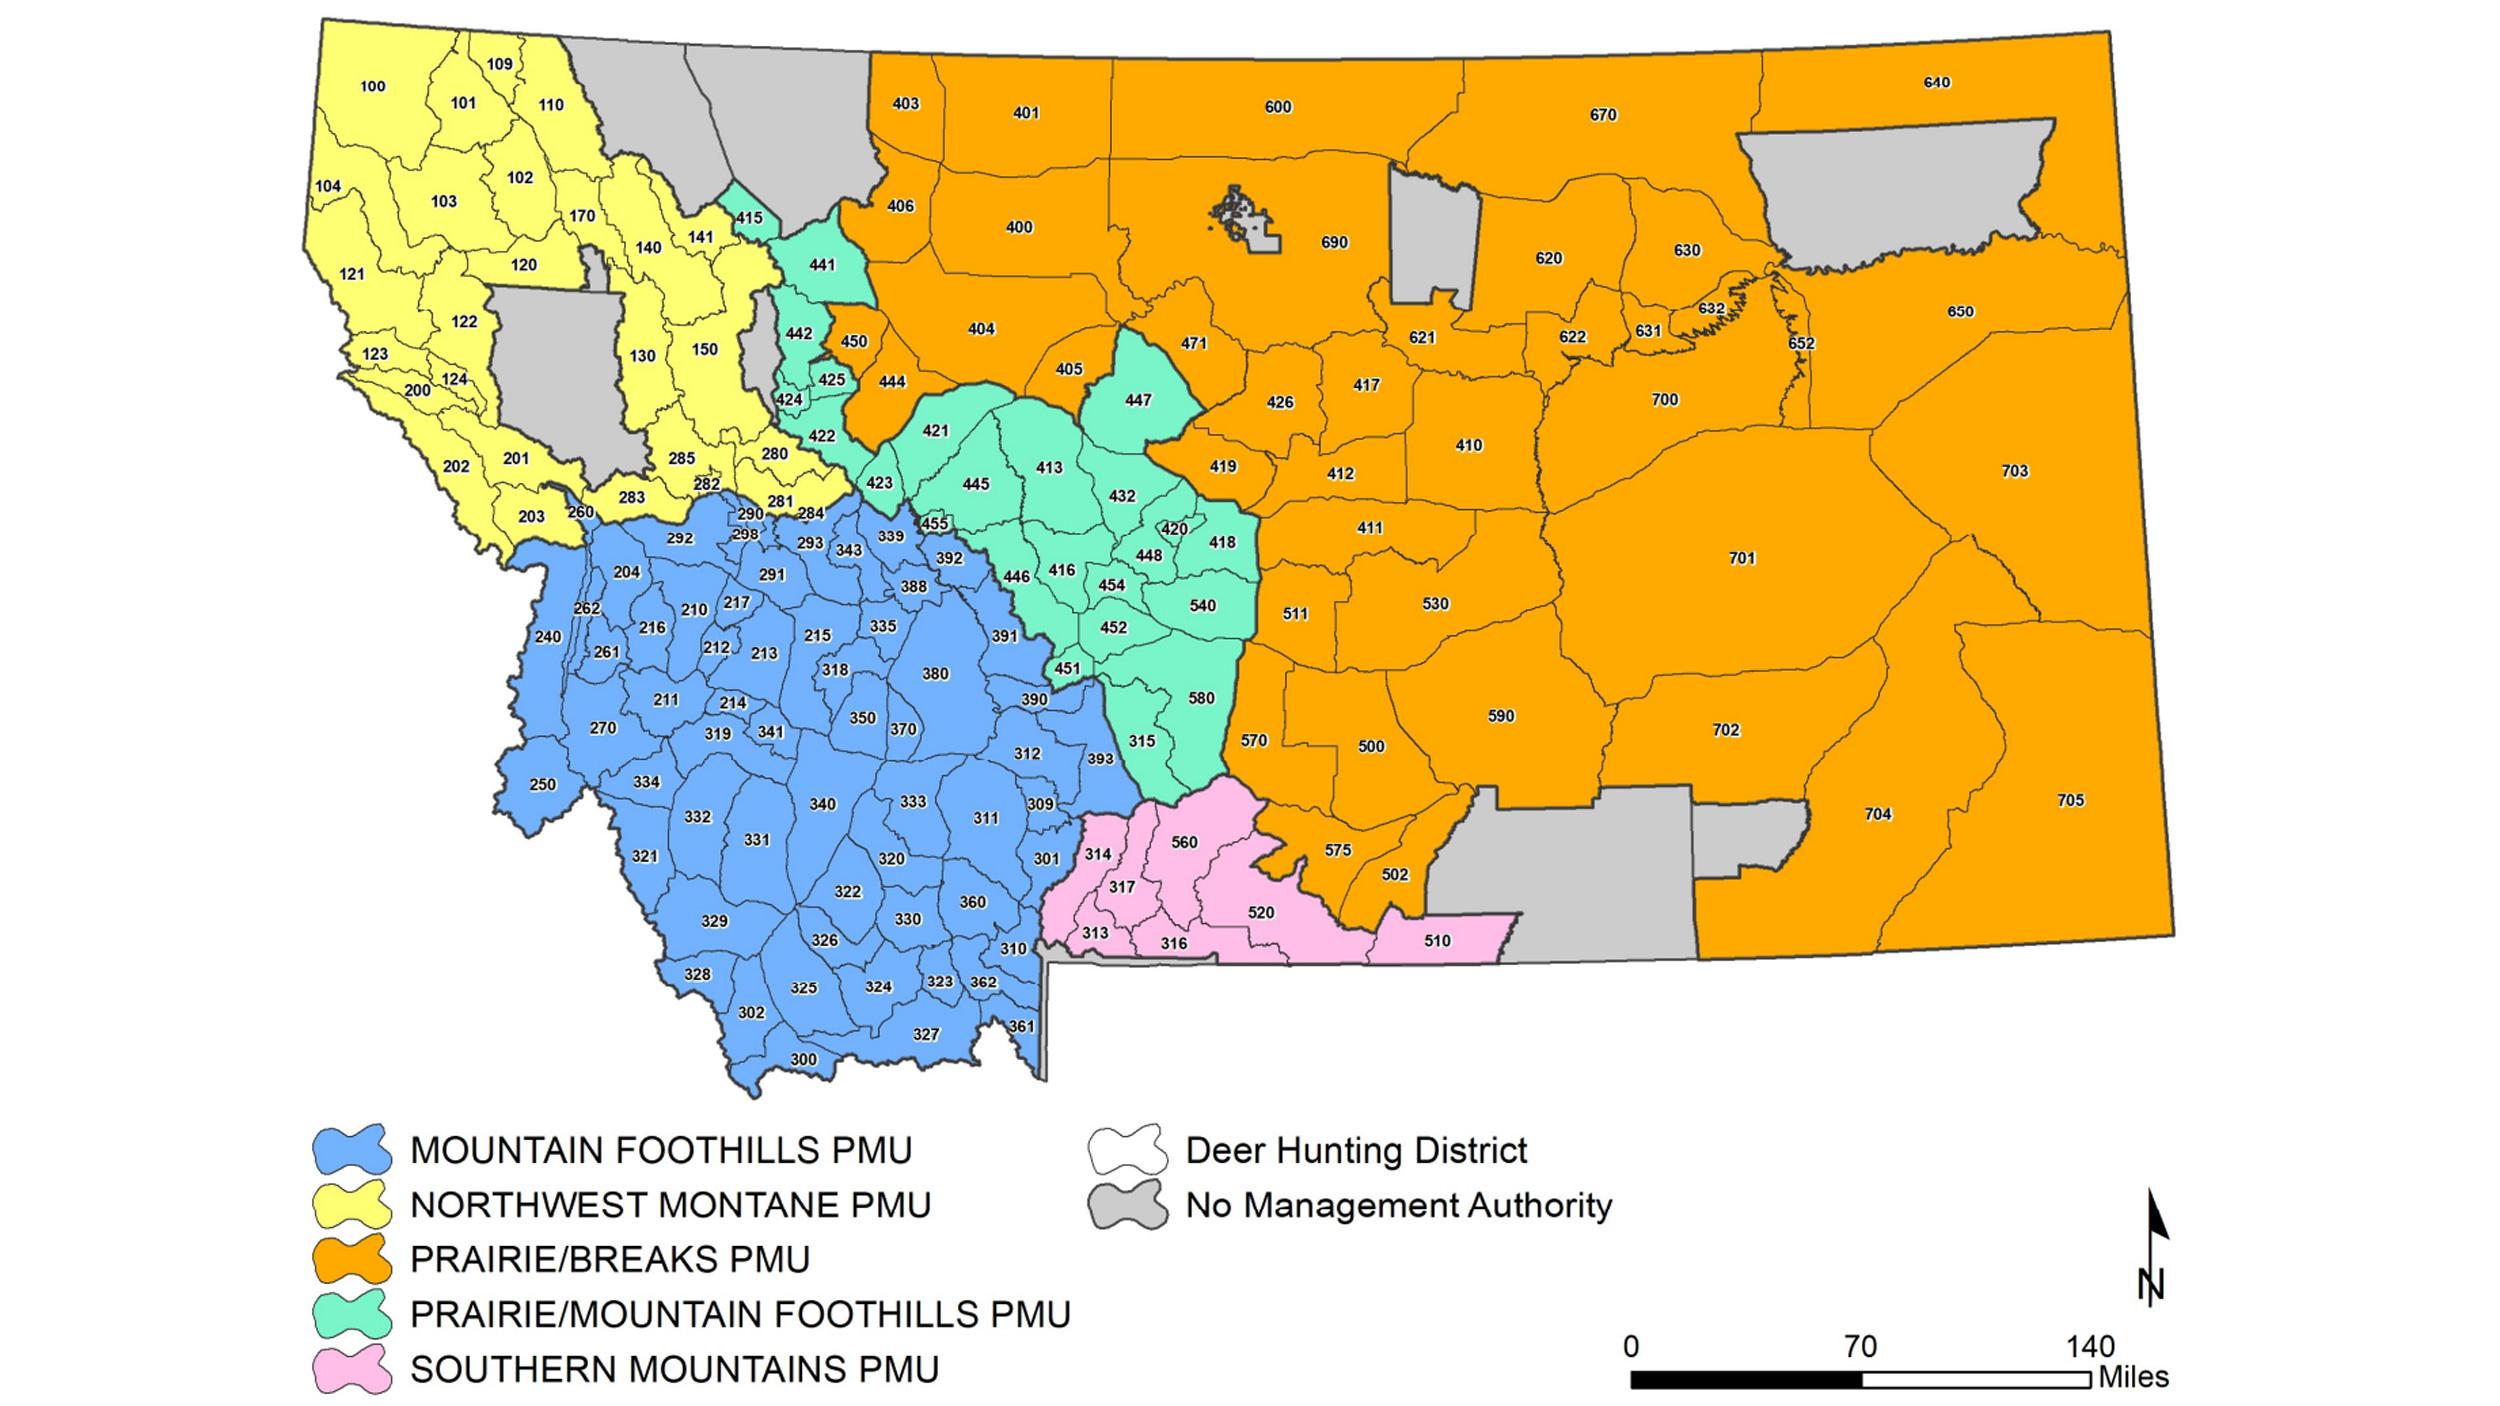
Montana mule deer Population Management Units.
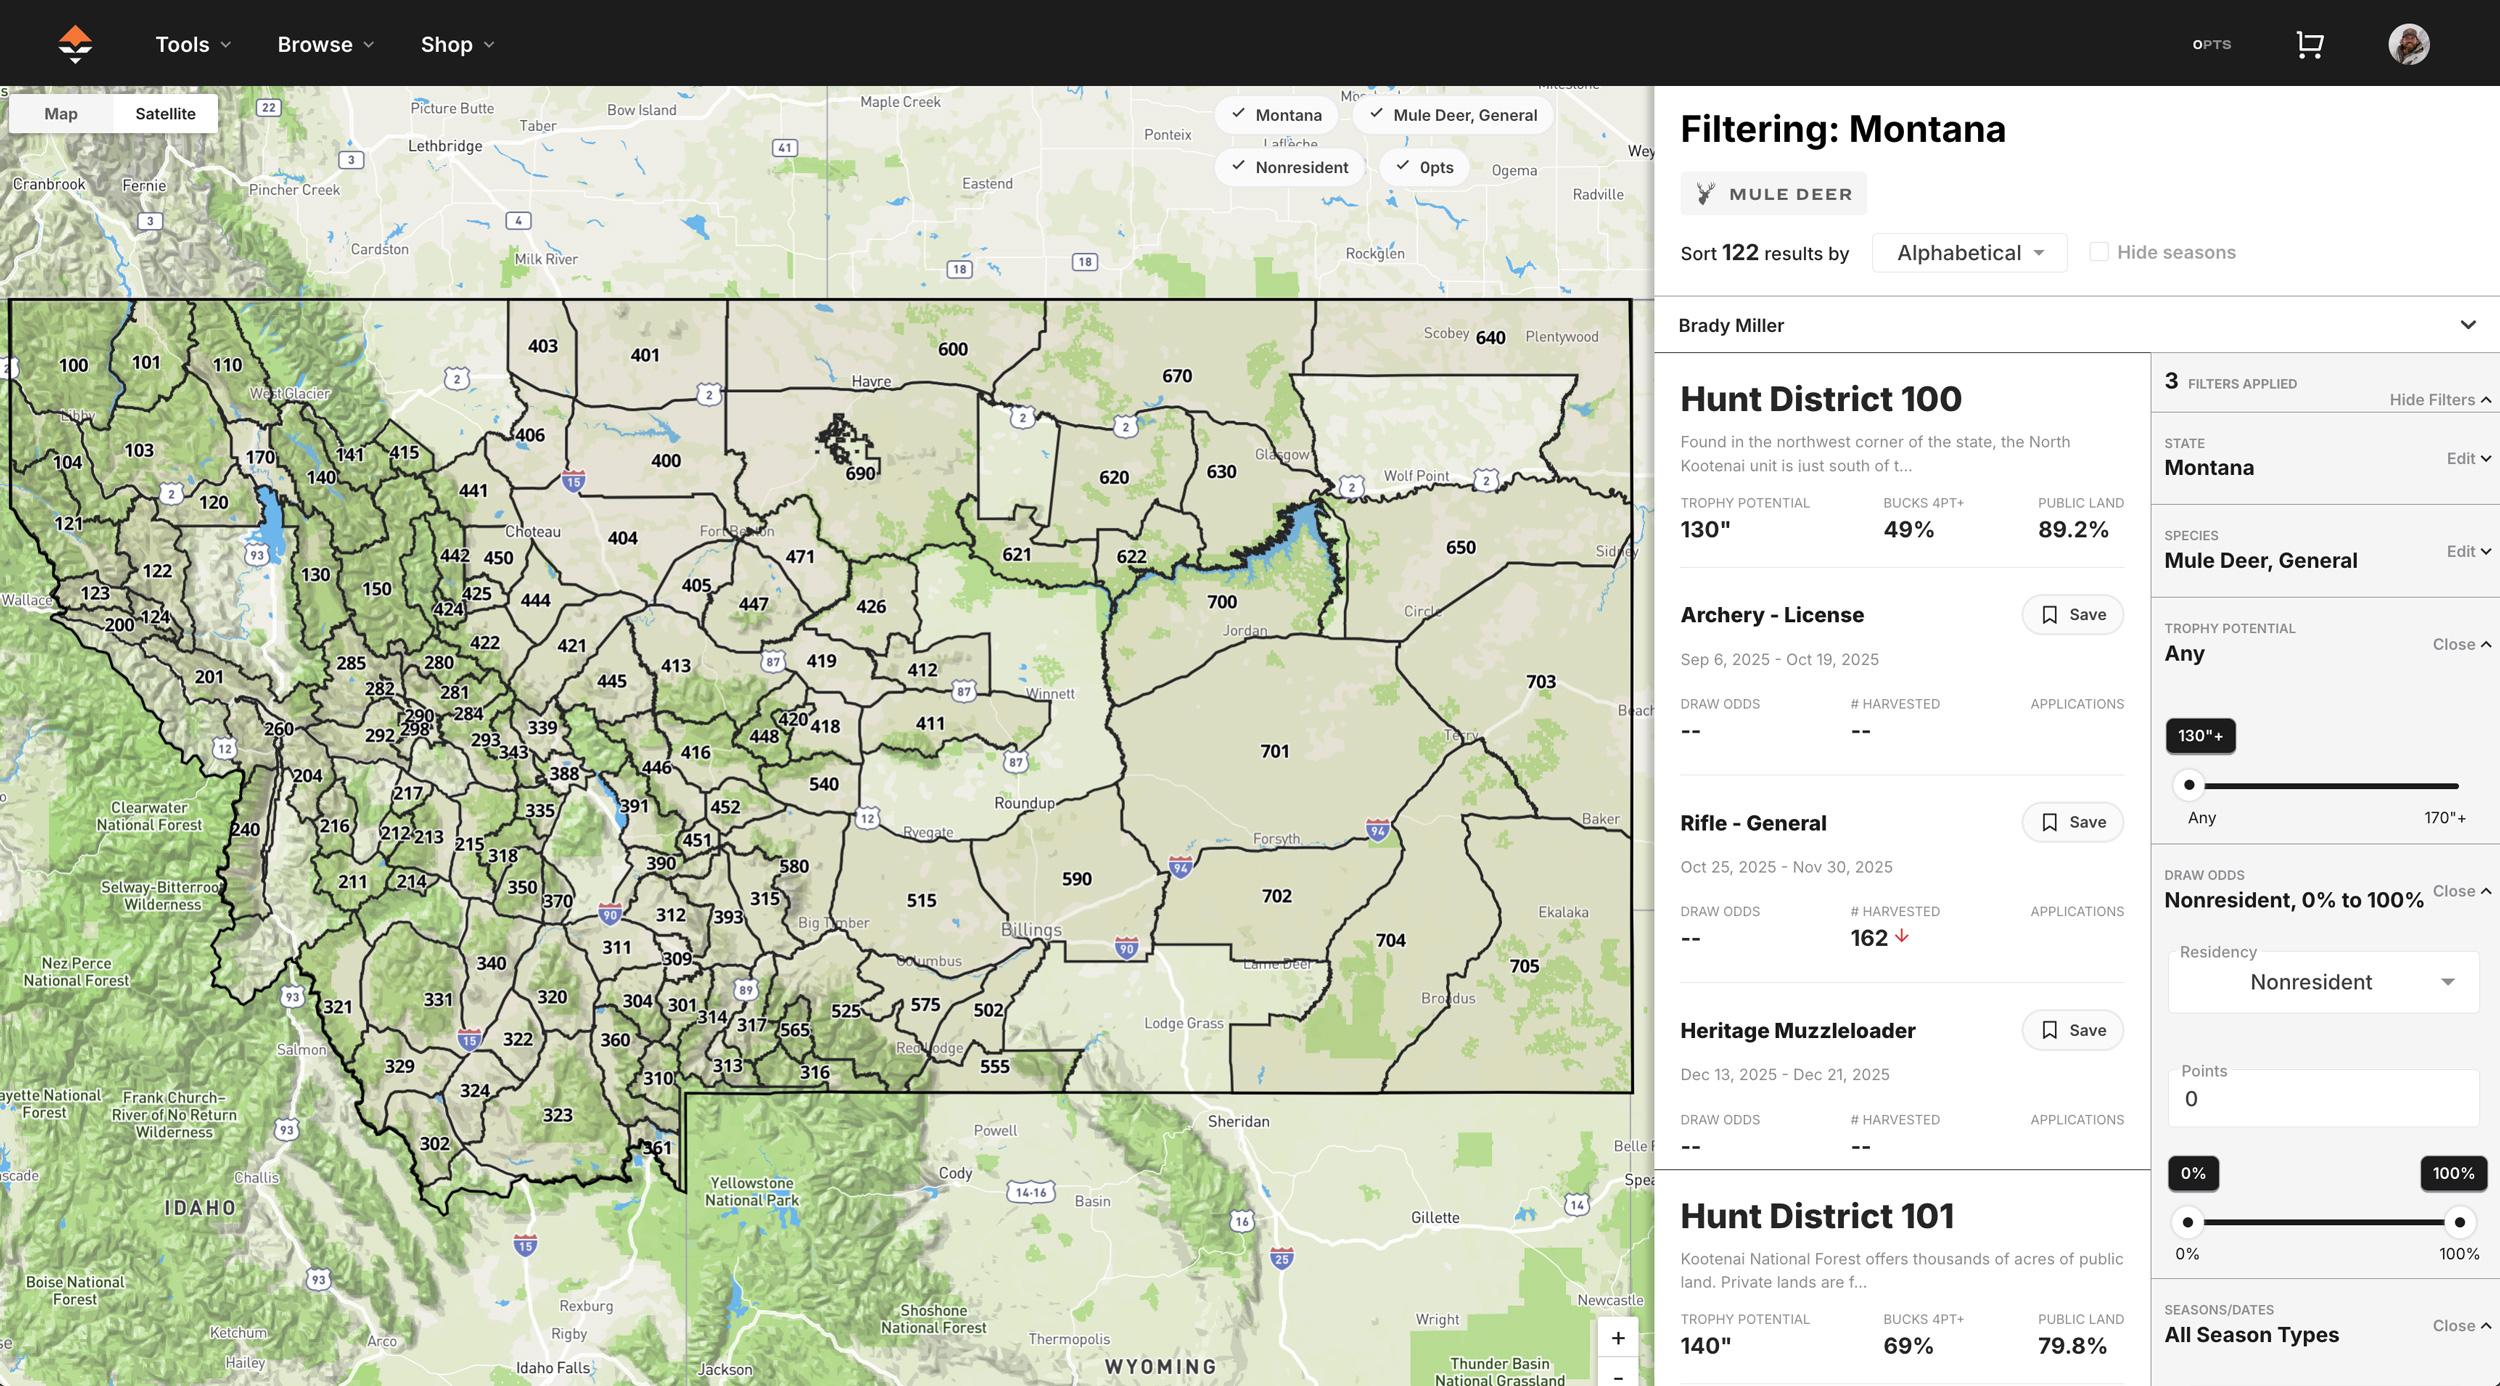
A screenshot of all the Montana general season mule deer hunt districts on GOHUNT's Filtering research tool.
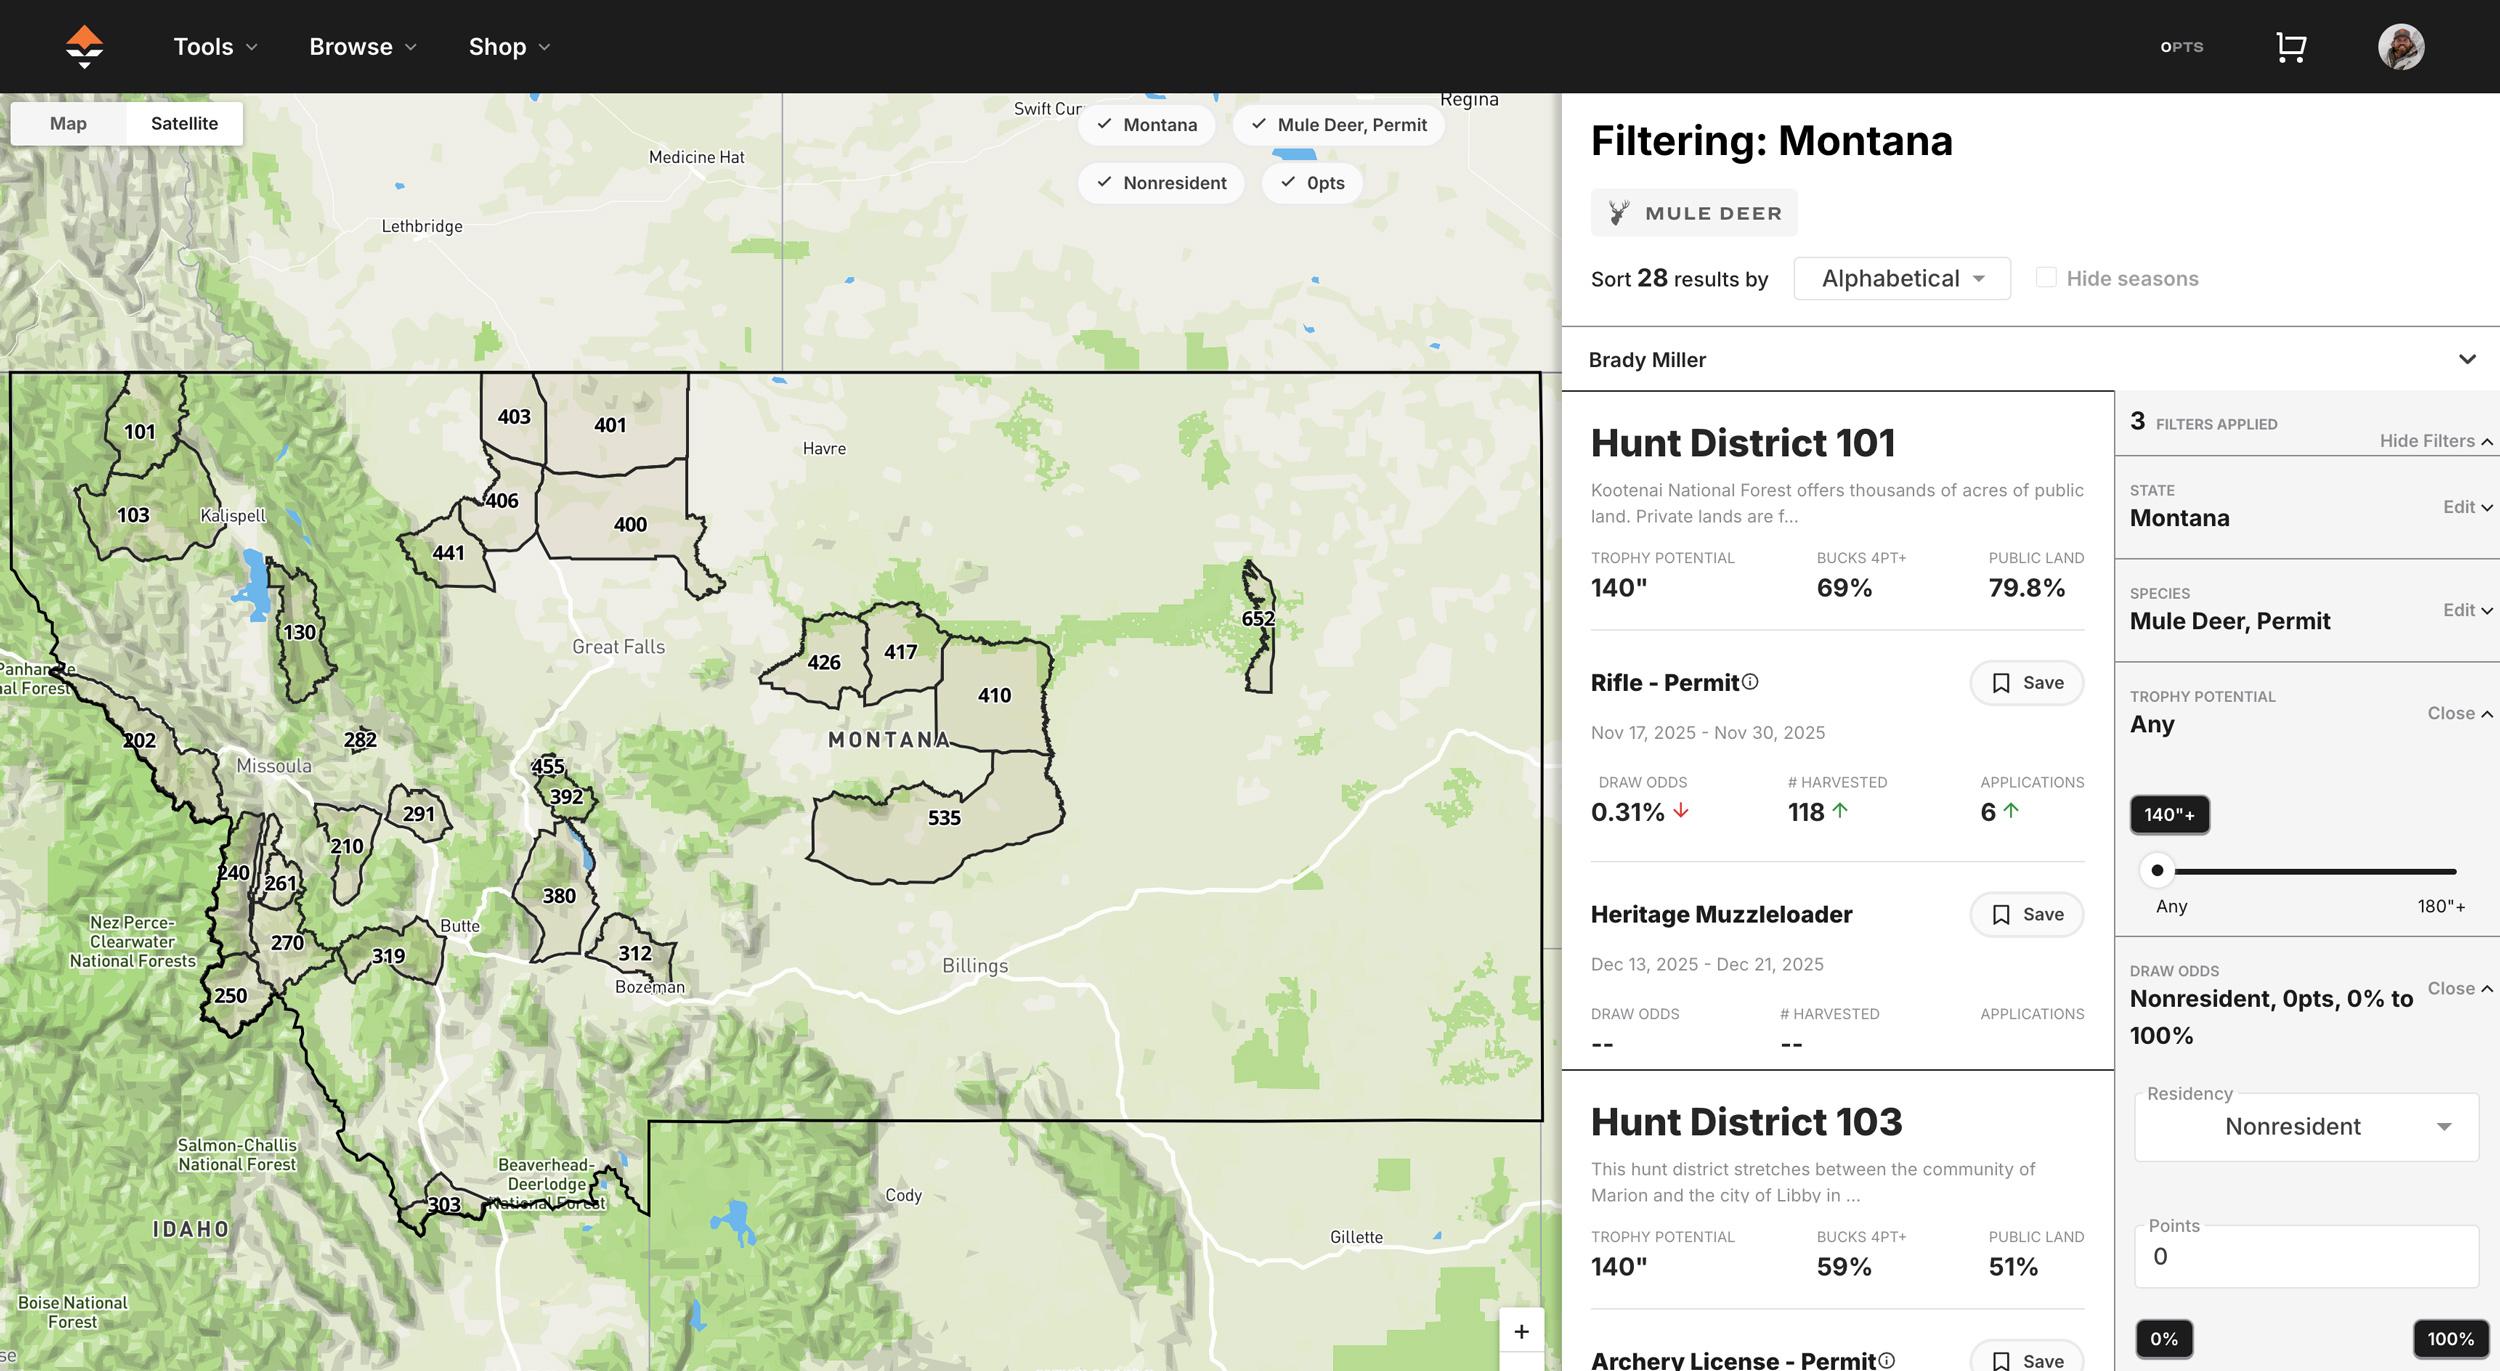
A screenshot of all the Montana permit mule deer hunt districts on GOHUNT's Filtering research tool.
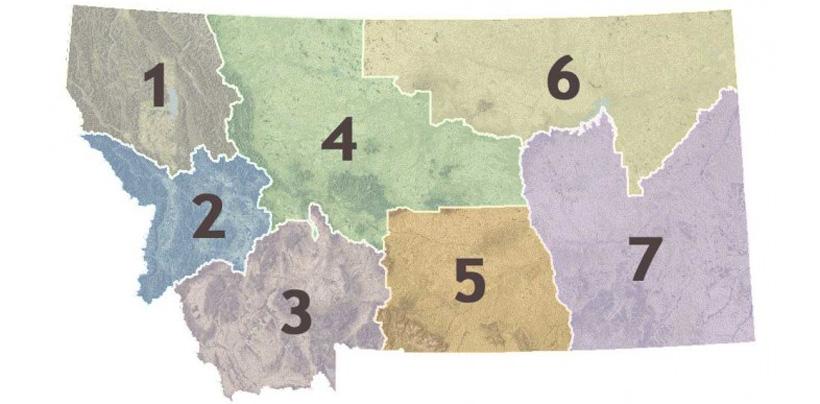
Montana's hunting region map.
Region 1 |
Region 2 |
Region 3 |
Region 4 |
Region 5 |
Region 6 |
Region 7 |
Statewide Total |
2005 |
15,018 |
18,599 |
51,116 |
76,408 |
43,139 |
37,188 |
74,714 |
316,182 |
2006 |
16,588 |
21,209 |
52,477 |
68,337 |
38,434 |
48,902 |
98,061 |
344,008 |
2007 |
13,720 |
24,837 |
62,759 |
70,262 |
41,765 |
39,683 |
93,650 |
346,676 |
2008 |
11,685 |
16,188 |
46,594 |
65,826 |
41,791 |
51,428 |
101,169 |
334,681 |
2009 |
9,297 |
13,229 |
40,746 |
59,589 |
39,813 |
45,056 |
93,167 |
300,897 |
2010 |
8,984 |
11,486 |
33,624 |
50,096 |
38,334 |
35,488 |
69,213 |
247,225 |
2011 |
13,016 |
14,226 |
33,293 |
46,384 |
34,720 |
42,053 |
65,549 |
249,241 |
2012 |
6,495 |
11,472 |
33,204 |
46,216 |
33,836 |
32,983 |
47,424 |
211,630 |
2013 |
7,547 |
12,754 |
34,172 |
49,210 |
37,977 |
36,674 |
53,934 |
232,268 |
2014 |
10,728 |
12,267 |
35,482 |
56,133 |
32,185 |
37,487 |
79,287 |
263,569 |
2015 |
8,065 |
14,267 |
38,912 |
56,629 |
32,042 |
43,561 |
103,812 |
297,288 |
2016 |
6,918 |
15,960 |
43,049 |
64,264 |
36,182 |
64,660 |
135,000 |
366,033 |
2017 |
10,770 |
17,345 |
50,496 |
71,359 |
38,357 |
65,848 |
132,000 |
386,175 |
2018 |
5,800 |
13,864 |
43,835 |
66,281 |
36,965 |
65,371 |
117,519 |
349,635 |
2019 |
6,277 |
11,530 |
42,774 |
59,783 |
32,226 |
66,510 |
102,538 |
321,638 |
2020 |
7,356 |
10,071 |
39,004 |
60,701 |
32,583 |
64,940 |
114,035 |
328,690 |
2021 |
6,386 |
9,551 |
43,025 |
58,082 |
32,103 |
84,766 |
77,140 |
311,053 |
2022 |
6,962 |
9,607 |
42,602 |
56,253 |
24,980 |
62,749 |
58,623 |
261,776 |
2023 |
7,419 |
11,423 |
42,016 |
51,044 |
26,457 |
62,468 |
55,604 |
256,431 |
2024 |
8,499 |
13,191 |
43,037 |
55,998 |
23,510 |
45,878 |
59,044 |
249,157 |
Region 1 | Region 2 | Region 3 | Region 4 | Region 5 | Region 6 | Region 7 | Statewide Total | |
2005 | 15,018 | 18,599 | 51,116 | 76,408 | 43,139 | 37,188 | 74,714 | 316,182 |
2006 | 16,588 | 21,209 | 52,477 | 68,337 | 38,434 | 48,902 | 98,061 | 344,008 |
2007 | 13,720 | 24,837 | 62,759 | 70,262 | 41,765 | 39,683 | 93,650 | 346,676 |
2008 | 11,685 | 16,188 | 46,594 | 65,826 | 41,791 | 51,428 | 101,169 | 334,681 |
2009 | 9,297 | 13,229 | 40,746 | 59,589 | 39,813 | 45,056 | 93,167 | 300,897 |
2010 | 8,984 | 11,486 | 33,624 | 50,096 | 38,334 | 35,488 | 69,213 | 247,225 |
2011 | 13,016 | 14,226 | 33,293 | 46,384 | 34,720 | 42,053 | 65,549 | 249,241 |
2012 | 6,495 | 11,472 | 33,204 | 46,216 | 33,836 | 32,983 | 47,424 | 211,630 |
2013 | 7,547 | 12,754 | 34,172 | 49,210 | 37,977 | 36,674 | 53,934 | 232,268 |
2014 | 10,728 | 12,267 | 35,482 | 56,133 | 32,185 | 37,487 | 79,287 | 263,569 |
2015 | 8,065 | 14,267 | 38,912 | 56,629 | 32,042 | 43,561 | 103,812 | 297,288 |
2016 | 6,918 | 15,960 | 43,049 | 64,264 | 36,182 | 64,660 | 135,000 | 366,033 |
2017 | 10,770 | 17,345 | 50,496 | 71,359 | 38,357 | 65,848 | 132,000 | 386,175 |
2018 | 5,800 | 13,864 | 43,835 | 66,281 | 36,965 | 65,371 | 117,519 | 349,635 |
2019 | 6,277 | 11,530 | 42,774 | 59,783 | 32,226 | 66,510 | 102,538 | 321,638 |
2020 | 7,356 | 10,071 | 39,004 | 60,701 | 32,583 | 64,940 | 114,035 | 328,690 |
2021 | 6,386 | 9,551 | 43,025 | 58,082 | 32,103 | 84,766 | 77,140 | 311,053 |
2022 | 6,962 | 9,607 | 42,602 | 56,253 | 24,980 | 62,749 | 58,623 | 261,776 |
2023 | 7,419 | 11,423 | 42,016 | 51,044 | 26,457 | 62,468 | 55,604 | 256,431 |
2024 | 8,499 | 13,191 | 43,037 | 55,998 | 23,510 | 45,878 | 59,044 | 249,157 |
Region |
10-year average population |
2024 population |
Percent change |
Region 1 |
7,445 |
8,499 |
+14.16% |
Region 2 |
12,681 |
13,191 |
+4.02% |
Region 3 |
42,875 |
43,037 |
+0.38% |
Region 4 |
60,039 |
55,998 |
-6.73% |
Region 5 |
31,541 |
23,510 |
-25.46% |
Region 6 |
62,675 |
45,878 |
-26.80% |
Region 7 |
95,532 |
59,044 |
-38.19% |
Region | 10-year average population | 2024 population | Percent change |
Region 1 | 7,445 | 8,499 | +14.16% |
Region 2 | 12,681 | 13,191 | +4.02% |
Region 3 | 42,875 | 43,037 | +0.38% |
Region 4 | 60,039 | 55,998 | -6.73% |
Region 5 | 31,541 | 23,510 | -25.46% |
Region 6 | 62,675 | 45,878 | -26.80% |
Region 7 | 95,532 | 59,044 | -38.19% |
Region |
10-year average bucks taken |
2024 Bucks harvested |
Percent change |
Region 1 |
1,002 |
1,187 |
+18.46% |
Region 2 |
1,646 |
1,878 |
+14.09% |
Region 3 |
5,807 |
6,376 |
+9.80% |
Region 4 |
8,673 |
7,697 |
-11.25% |
Region 5 |
4,492 |
3,474 |
-22.66% |
Region 6 |
7,511 |
6,227 |
-17.09% |
Region 7 |
9,245 |
6,697 |
-27.56% |
Region | 10-year average bucks taken | 2024 Bucks harvested | Percent change |
Region 1 | 1,002 | 1,187 | +18.46% |
Region 2 | 1,646 | 1,878 | +14.09% |
Region 3 | 5,807 | 6,376 | +9.80% |
Region 4 | 8,673 | 7,697 | -11.25% |
Region 5 | 4,492 | 3,474 | -22.66% |
Region 6 | 7,511 | 6,227 | -17.09% |
Region 7 | 9,245 | 6,697 | -27.56% |
Year |
Resident |
Nonresident |
2024 |
8 |
6 |
2023 |
9 |
6 |
2022 |
NA |
NA |
2021 |
8 |
6 |
2020 |
NA |
NA |
2019 |
8 |
6 |
2018 |
NA |
NA |
2017 |
7 |
6 |
2016 |
8 |
6 |
2015 |
NA |
NA |
2014 |
NA |
NA |
2013 |
8 |
6 |
2012 |
NA |
NA |
2011 |
8 |
6 |
2010 |
8 |
7 |
2009 |
8 |
6 |
2008 |
8 |
6 |
2007 |
7 |
6 |
2006 |
7 |
6 |
2005 |
7 |
6 |
2004 |
7 |
6 |
Year | Resident | Nonresident |
2024 | 8 | 6 |
2023 | 9 | 6 |
2022 | NA | NA |
2021 | 8 | 6 |
2020 | NA | NA |
2019 | 8 | 6 |
2018 | NA | NA |
2017 | 7 | 6 |
2016 | 8 | 6 |
2015 | NA | NA |
2014 | NA | NA |
2013 | 8 | 6 |
2012 | NA | NA |
2011 | 8 | 6 |
2010 | 8 | 7 |
2009 | 8 | 6 |
2008 | 8 | 6 |
2007 | 7 | 6 |
2006 | 7 | 6 |
2005 | 7 | 6 |
2004 | 7 | 6 |
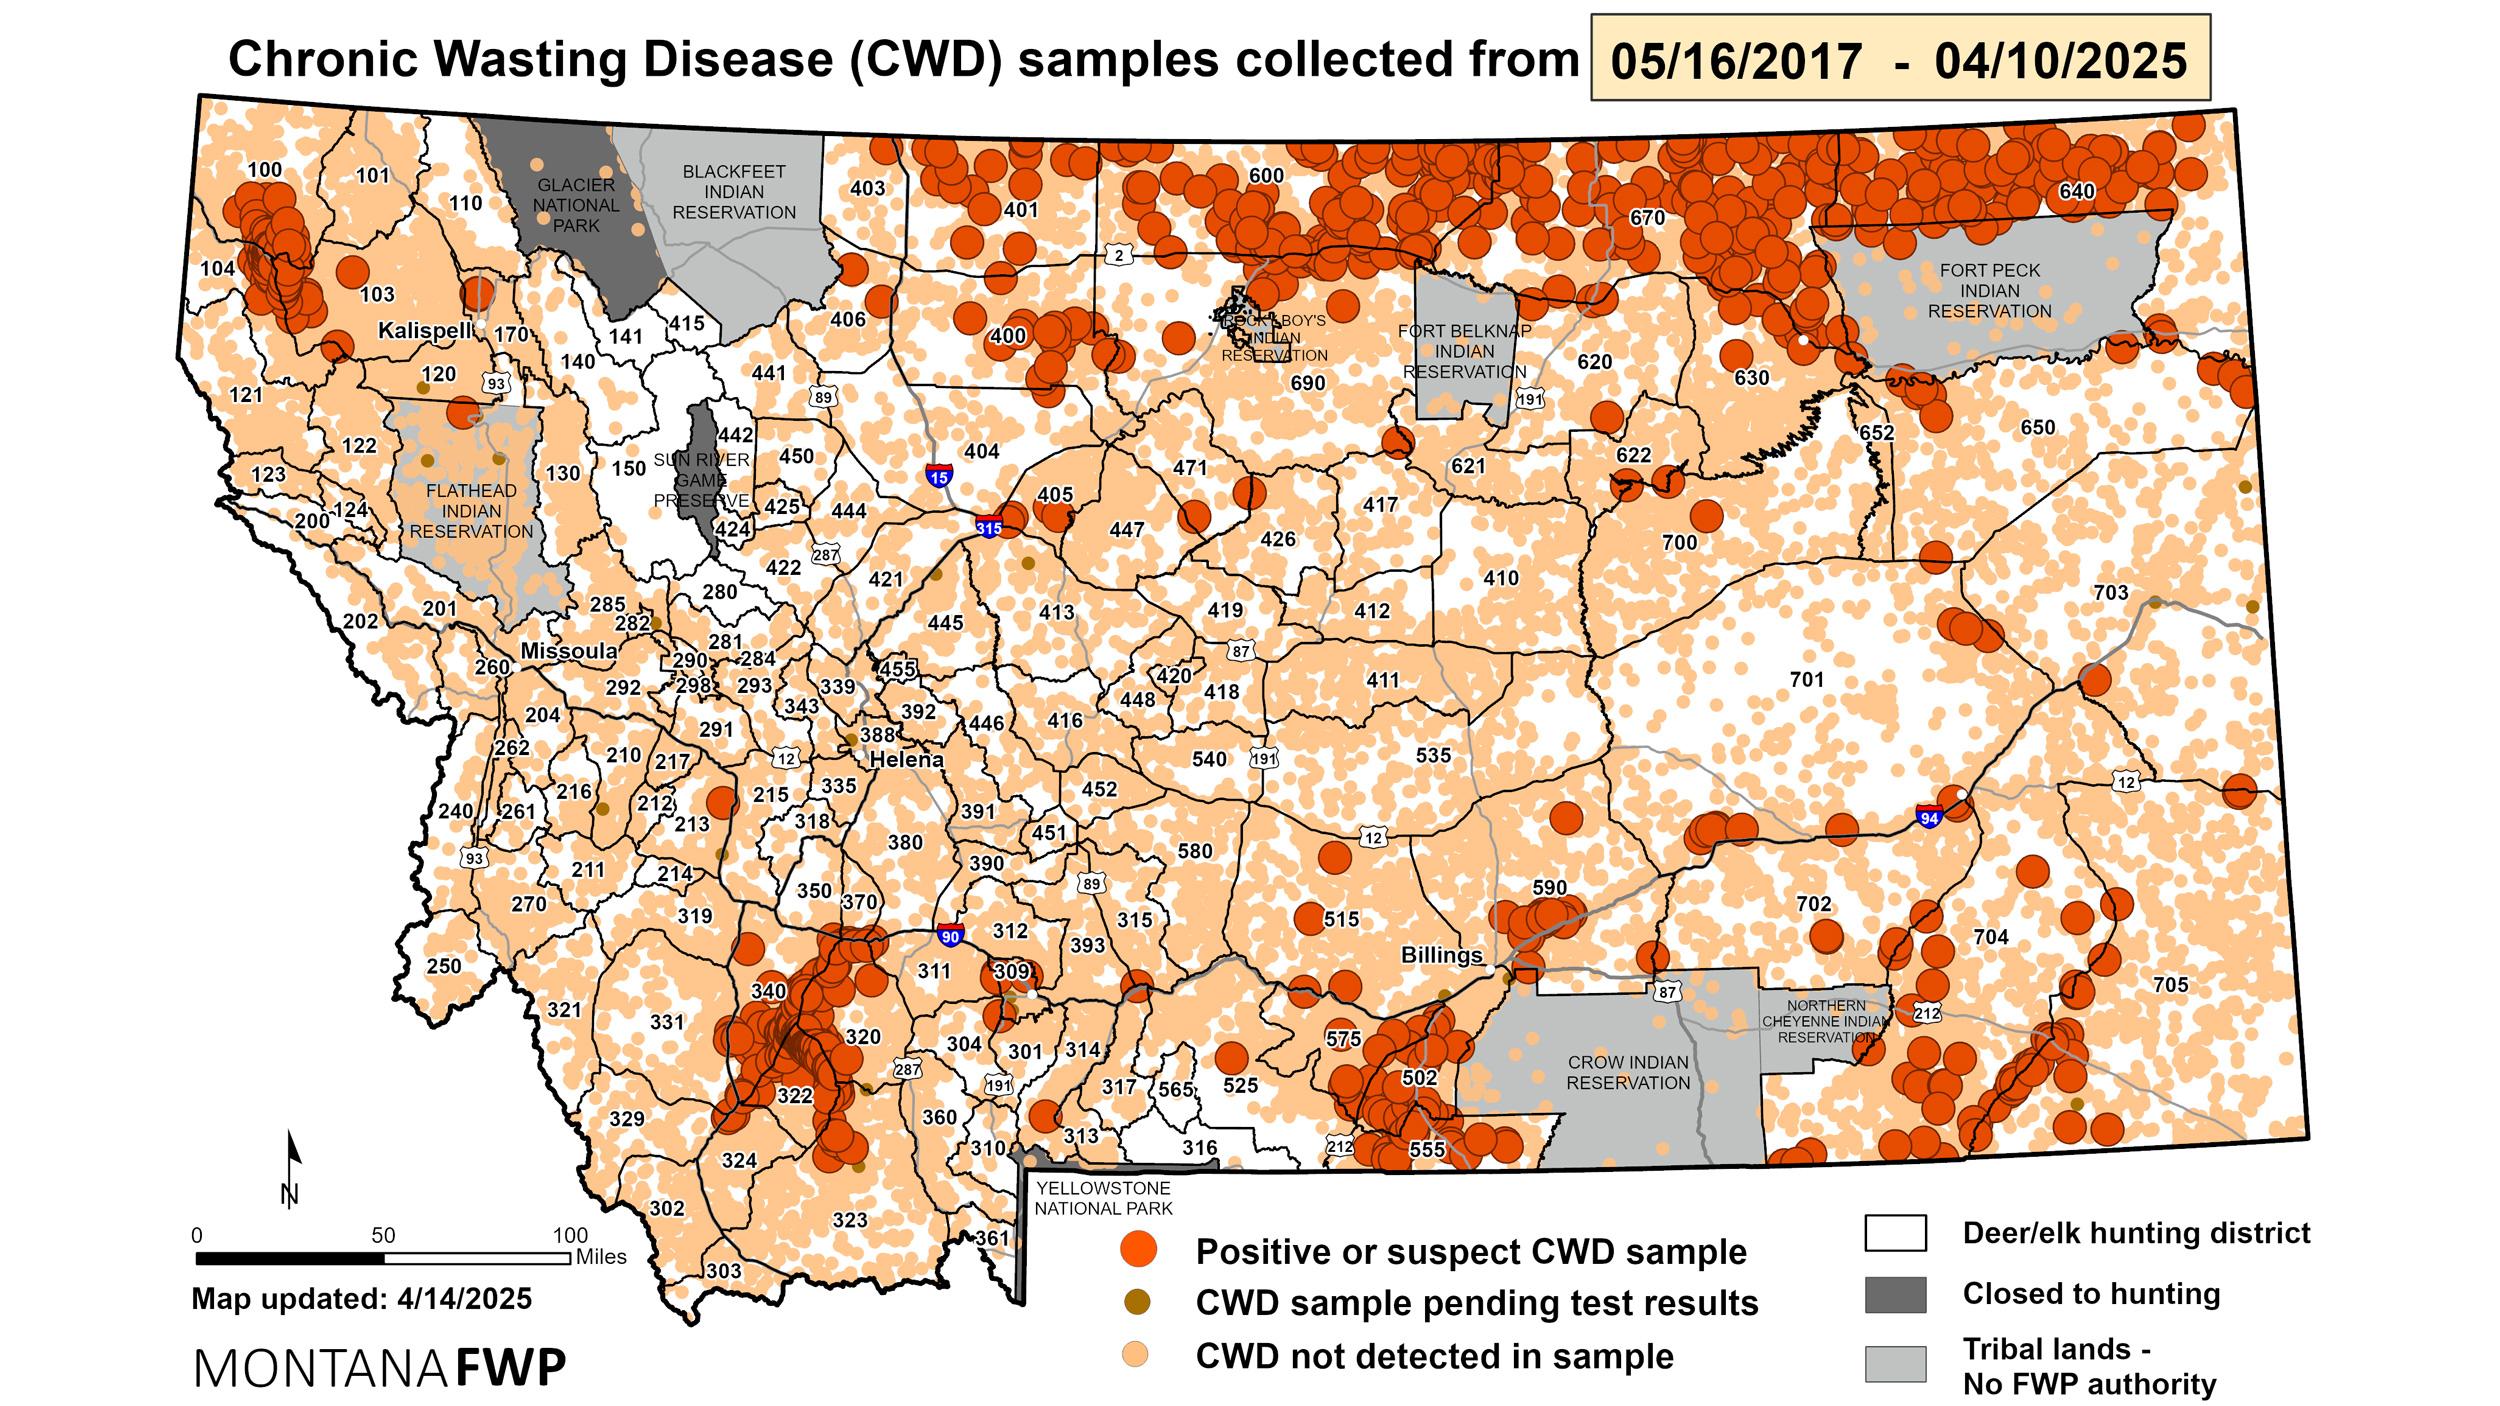
Montana chronic wasting disease samples and test results through April 2025.
Montana is a giant state, and it greatly varies from the west side to the east side. Mule deer populations, hunting pressure, and harvest success are also vastly different across Montana. Below is a full overview of Montana mule deer populations, harvest trends, resident and nonresident numbers, and much more.
Most know I love mule deer, and I love taking a deep dive into reports that states put out about these amazing animals. All the data below was pulled from Montana Fish, Wildlife, and Parks (FWP). I then spent a long time crunching everything into graphics and tables in order to make sense of the data. Be warned... this article is data-heavy! There's definitely more data out there that I like to look at when it comes to mule deer in Montana, but to save some length, this is probably some of the data that most hunters are interested in.
In Montana, "mule deer are managed according to an Adaptive Harvest Management strategy (AHM, 2020) in which hunting regulation packages are recommended according to biological “triggers” that indicate a change in population trend (growth, stable, or decline). These triggers are most often measured via aerial survey data (i.e., minimum counts, fawn to doe ratios, doe to buck ratios), collected within trend areas that are representative of the broader landscape." Exerpt from the October 2021 version of the Montana Adaptive Harvest Management strategy. It's a good read that you can access in the link below:
This goal provides direction in the development of mule deer management objectives and regulatory alternatives. Management decisions will be based on the welfare of the mule deer resource first, and recreational opportunities will be provided consistent with the dynamic nature of mule deer populations.
In accordance with this goal, Montana’s mule deer management program integrates the following elements: 1) Habitat Protection and Enhancement 2) Population Surveys 3) Harvest Management 4) Access Management 5) Research 6) Information & Education 7) Enforcement of Hunting Regulations 8) Minimization of Game Damage Complaints from Private Landowners 9) Hunter and Public Preferences and Attitudes
Most are probably aware of Hunting Regions in Montana, but there is another map the state uses for population management. Montana FWP defines mule deer population objectives for groups of Hunt Districts known as Population Management Units (PMUs). Hunting Districts within a PMU all share similar habitat and mule deer population dynamics and are logically grouped together. There are five PMUs within the state, with each having unique population indicators and metrics and a corresponding monitoring program.
Most Hunt Districts have regulations designed to provide maximum hunting opportunity and harvest of mule deer consistent with the long-term welfare of the mule deer resource.
Let’s say you are a nonresident or even a resident and have a general season Montana deer tag; now what? There are a lot of decisions to be made on where to hunt, as you can hunt a ton of the state on a general season tag. This information, as well as all of the research that can be found on GOHUNT's Filtering, is a great place to start when trying to hone in on where you might hunt this fall or in future years. Note: Don't just assume that by looking at population trends and harvest trends, you have found a honey hole. There is a lot of data presented here, and keep in mind, there can be some phenomenal hunting all across the state.
Statewide, mule deer populations in Montana during the 2024 season were hovering around 249,157, which is down 35.48% from a peak in 2017 of 386,175 but still vastly higher than the low in 2012 of 211,360.
Montana mule deer populations have been on a downward swing for the past seven years. You’ll also see that Montana mule deer population numbers have seen several peaks and valleys in the past 20 years.
Montana is broken up into seven different hunting regions. For a general season rifle tag, in 2025, you have a total of 122 Hunt Districts that you can hunt with that tag, and they are distributed across the seven regions. This is where GOHUNT's Filtering research tool can vastly cut the learning curve in figuring out where to hunt.
For a permit mule deer hunt, there are a total of 28 Hunt Districts. While lower in number, they are found across all hunt regions except for Region 7.
The graphic below showcases a region-by-region heat map of mule deer populations in Montana from 2024. The cooler colors mean a lower population, and the hotter colors mean a higher population.
The graph below shows the total harvest of all Montana mule deer and also breaks out total buck, doe, and fawn harvest.
When comparing the region-by-region population graphic in the section above with the region harvest graphic below, you'll quickly notice that the regions with a high mule deer population equals a higher buck harvest, which, in a sense, shouldn't come as no surprise (but keep in mind there are other factors for this as well and so more data will be needed to dive in further in this area). The maps are almost a complete mirror of each other.
The next group of graphics showcases the trends in mule deer bucks taken in Montana.
Compare this with a look at the 10-year average.
Finally, below is a look at 20 years of Montana mule deer bucks taken by region. Also note that in 2021, 2022, and 2023, Region 6 has taken more mule deer bucks than Region 7, which hasn't happened in the 20 years' worth of data.
When trying to find a place to hunt in Montana, remember there are a vast amount of private lands that are enrolled into Montana Fish Wildlife and Parks Block Management Program. Learn more about this program here.
Also, be sure to check out each property with a link to the rules of each BMA on GOHUNT Maps. Once you are in GOHUNT Maps, tap on the Library, then select Montana. Under "Access," turn on Block Management and Block Management Sign-In Boxes.
Region 1 is found in the northwest corner of the state and features some of the roughest and toughest country to hunt. This area experiences heavy snowfall and rain throughout the year, which leads to incredible amounts of dense ground cover. This vegetation, combined with steep ridges that top out in impassable rocky cliffs, gives hunters a physically demanding hunt. Mule deer are typically found in lower densities here; however, they have the potential to turn into mature, dark-antlered giants thanks to the terrain and cover. The overall trophy potential is generally lower in this area, but that figure can be slightly skewed due to the fact that bucks can easily grow old, never see a hunter, and die in this country. Winterkill can be a concern if heavy snowfall hits this region. While this is a physically demanding area of the state, this region will present hunters with unparalleled beauty and a hard-earned opportunity.
Region 2, located on the extreme western edge of the state, is home to the famous Bitterroot Valley, though hunting mule deer in this area isn't exactly on par with what it used to be, but don't get me wrong, this is still a phenomenal region. Going against the norm are Hunt Districts 261, 262, and 270 which provide some of the biggest mule deer in the state, with a handful eclipsing the 200” mark taken every year. With that comes extremely tough draw odds for both residents and nonresidents. Check out the draw odds to see for yourself. Hunting competition will be high around the city of Missoula, situated at the heart of the region. At the northern end of the area, hunters will encounter dense forests similar to those in Region 1, before the terrain and vegetation transition into more open and sage-covered slopes on the southern end. Previous logging and mining activity can be found across much of the region, providing hunters with easy access into the backcountry and making navigation and avoiding crowds somewhat difficult. Winterkill could be a minor concern in this area if heavy snowfall occurs, although for the most part, it is not expected to have a significant impact.
The southwest corner of the state supports good populations of mule deer and also features excellent wintering grounds for migratory herds of mule deer. Region 3 attracts a lot of rifle elk hunters, which can really increase competition during the any legal weapon general season. More opportunities for backcountry backpack-style hunting can be found here for hunters looking to distance themselves from the competition. This will help hunters find older bucks. Wolves continue to be a problem in this area during winter months, though hunting and trapping efforts have somewhat curbed hunter-wolf altercations during the season. This area holds some of the highest concentrations of grizzly bears and experiences the bulk of hunter and bear encounters. This problem is exemplified in areas immediately surrounding Yellowstone National Park.
Region 4 is found in the north-central portion of the state and offers an incredible array of terrain, ranging from steep, heavily forested slopes to sage-covered coulees in the Missouri River Breaks. The competition will be high in most areas, though hunters can still find areas to escape deep into the backcountry. The northern part of the region features large expanses of private land, which can make access difficult, though some great bucks can be found here. On the western side of the area, hunters can hunt the famed Rocky Mountain Front, which features breathtaking scenery, very rugged country, and can be good mule deer hunting. Grizzly bears are also very prevalent in this area, and proper precautions must be adhered to. The eastern side of this region tends to provide a better hunt for most hunters as deer can be glassed from a long distance, making it much easier to find larger-caliber bucks.
This region, located in south central Montana, generally produces smaller bucks compared to the rest of the state; however, some great deer are taken every year. Large ranches are found here and they will hold large populations of deer, and competition on the public lands surrounding these areas can be tight. On the southern end of the region, hunters can find access to the Custer-Gallatin Forest, which can provide ample amounts of country to escape crowds. Be aware that getting into the backcountry can be very physically demanding, and game densities are very low.
Region 6 is an area that will see large amounts of hunters heading into the Missouri River Breaks, although some incredible hunting can also be found in the surrounding districts. Private lands dominate much of this area though sections of BLM land can provide hunters with great opportunities to escape the crowds and search for pockets of unpressured deer. The terrain here is mostly comprised of rolling hills with pockets of heavy timber and sage-covered coulees. Glassing is king in this country, and optics will play a pivotal role in the success of anyone hunting here.
One of the most popular regions for mule deer as it possesses the highest population of deer, this area will experience lots of pressure from other hunters. Pay close attention to sections of public land within the sea of private ranches; this can provide hunters with great opportunities to find mature deer. While most hunters will be seeking mule deer, there is some great whitetail here, too, with some bucks even reaching the 140” mark.
The following graph breaks down the percentage of mule deer bucks with 4 points or more.
Now, let's take a look at some resident and nonresident information.
First, the graphics below illustrate trends in resident and nonresident deer hunters from 2004 to 2024. Note: this isn't directly mule deer hunters, as the data could include whitetail hunters.
Keep in mind that the y-axis values are significantly different for these two graphics because there are many more resident hunters; however, some very interesting data is presented. I wanted to see the peaks and valleys a little easier in the data, which is why the Y-axis values start in different places rather than starting at zero.
If you take a look at the 21-year average of 124,207 resident and 27,108 nonresident deer hunters and compare that with the 2024 season, you'll see that residents are -3.32% below the 21-year average and nonresidents are 2.43% above the 21-year average.
And again, since the Y-axis is so vastly different from the above resident and nonresident graphs, I know some will point to that, so here are both residents and nonresidents plotted on the same graph, and you'll see things are a little more smoothed out.
The graphic below is another interesting one. The rolling 21-year average is residents take roughly 26,593 bucks per year, and nonresidents take 10,491. Broken out by an average percentage over 21 years, residents take an average of 71.48% of the bucks per year, and nonresidents take 28.52%.
Below is a breakdown of the resident and nonresident populations by weapon choice.
This information doesn't really paint a complete picture, as, in most years, FWP hasn't provided this data. But on average, residents spend 7.7 days hunting deer, and nonresidents spend 6.1 days hunting deer. Note: Montana doesn't separate this date for mule deer or whitetail deer.
I find the data presented in the "Results From a Montana 2023 Resident Mule Deer Hunter Survey" a solid read. And if you'd like to just read the summary, check out this document "Selected Results from a Resident Mule Deer Hunter Survey Conducted by Montana Fish, Wildlife & Parks in 2023." There are a bunch of other really great studies on mule deer in Montana. I highly suggest doing a search and reading the ones that interest you. You can find them by using a simple Google search or by using the more powerful Google Scholar.
If you made it this far, I tip my hat to you! Hopefully, all the data I presented helps paint a picture of where you might want to hunt. Still, even more importantly, it showcases some of the pressures that Montana is currently facing with the management of mule deer, battling unforeseen drought in some years and harsh winters in other years, plus the demand of what the public wants in terms of opportunity. Currently, Montana doesn't have mandatory harvest reporting, so the harvest numbers presented in this article are based on their surveys.
I really enjoyed compiling and analysing this data. Some of the region-by-region data is particularly interesting, especially in areas where residents have a distinct advantage in taking bucks and in places where nonresident pressure on bucks has increased to the point where nonresidents take more bucks than residents.
Again, you've probably heard me say this before, but I hope this helps you think outside the box when it comes to where you want to hunt in Montana and future years, how you will apply for the limited/special draw hunts, or general season mule deer hunts. At the end of the day, I love data, and I truly enjoyed putting this piece together. Remember, there's probably more that could be looked at and other pieces of data to incorporate into this, but I'll save that for another day. There are also some great ideas in the comments for additional ways to look at some of this data.
This article was originally published on October 16, 2023, and has been updated with more information and even more graphics than before. Enjoy!